A Brief Comparison of 10+ Best Google Analytics Alternatives
Google Analytics is one of the most widely used web analytics tools on the market today. It provides detailed information on website traffic, user behavior, and conversion rates, making it a valuable tool for website owners and marketers. It provides a wealth of data on how users interact with a website, including the number of visitors, the pages they visit, how long they stay, and how they arrived at the website. It also includes features such as conversion tracking, audience segmentation, and integration with other Google products, such as Google Search Console, Google Ads, and Google Tag Manager.
While Google Analytics is a powerful tool, it does have its drawbacks. One of the biggest concerns is the privacy of data collection. Google Analytics collects a large amount of data on users, including their location, behavior, and demographics. This data is then used to create user profiles and target advertising. Some users may feel uncomfortable with the level of data collection and tracking that Google Analytics provides.
To address these concerns, there are a number of alternatives to Google Analytics that focus on privacy. In this blog post, I will be comparing the top 10+ Google Analytics alternatives, including their features, pricing, and how they compare to Google Analytics. Whether you are a website owner or marketer, you will find something of value in this comparison. So, let's dive in!
What am I Looking For
I find that, while Google Analytics is a feature-complete solution, I only use a small fraction of its features and am therefore looking for a more streamlined solution.
Core metrics
I am looking for a solution that provides me with core analytics metrics, such as visitor count, page views, referral sources, and time on page, as well as basic demographic data (countries of origin) and technological metrics (browser, OS, and device information).
Accuracy
In addition to these core requirements, I am also looking for a solution that is accurate in its data collection and reporting, as this is essential for making informed decisions about my website.
Easy to use
A user-friendly interface and easy-to-understand dashboard are also important for me, as it will make it easier for me to extract insights from the data.
Lightweight
Furthermore, I want a platform that is lightweight and does not add a lot of payload to my website. Since Google Analytics tracking script can be quite bloated, and I am looking for a more lightweight solution.
Nice to have features
Live visitor count and data comparison are useful, but I can manage without them. I'm particularly interested in a feature that allows me to share a publicly accessible dashboard, so I can share my website's analytics data with others. An email report is also a nice addition.
Affordable
Lastly, affordability is a key consideration for me. I am willing to pay for a solution that provides me with the data and insights I need, but I appreciate free versions since it is only for my personal blog that does not generate revenue.
Overall, I am looking for a solution that provides me with the core analytics metrics I need, while also being affordable, accurate, lightweight, user-friendly, respects user privacy, and provides detailed analytics data for data-driven decisions.
An overview of the alternatives I tested
I have been experimenting with several Google Analytics alternatives over the past few days, including Ackee, Cabin, Cloudflare Web Analytics, Fathom Analytics, GoatCounter, Jetpack Stats, Matomo, Microanalytics, Plausible Analytics, Simple Analytics and Umami. I have installed all of these tools on the same website at the same time to see how accurately they collect data.
At first glance, one of the advantages of these alternatives is that most are either free or offer a free trial period. However, a disadvantage is that most do not have data comparison capabilities. Nevertheless, I'm looking forward to exploring the data collected by each tool and comparing it to Google Analytics.
Ackee
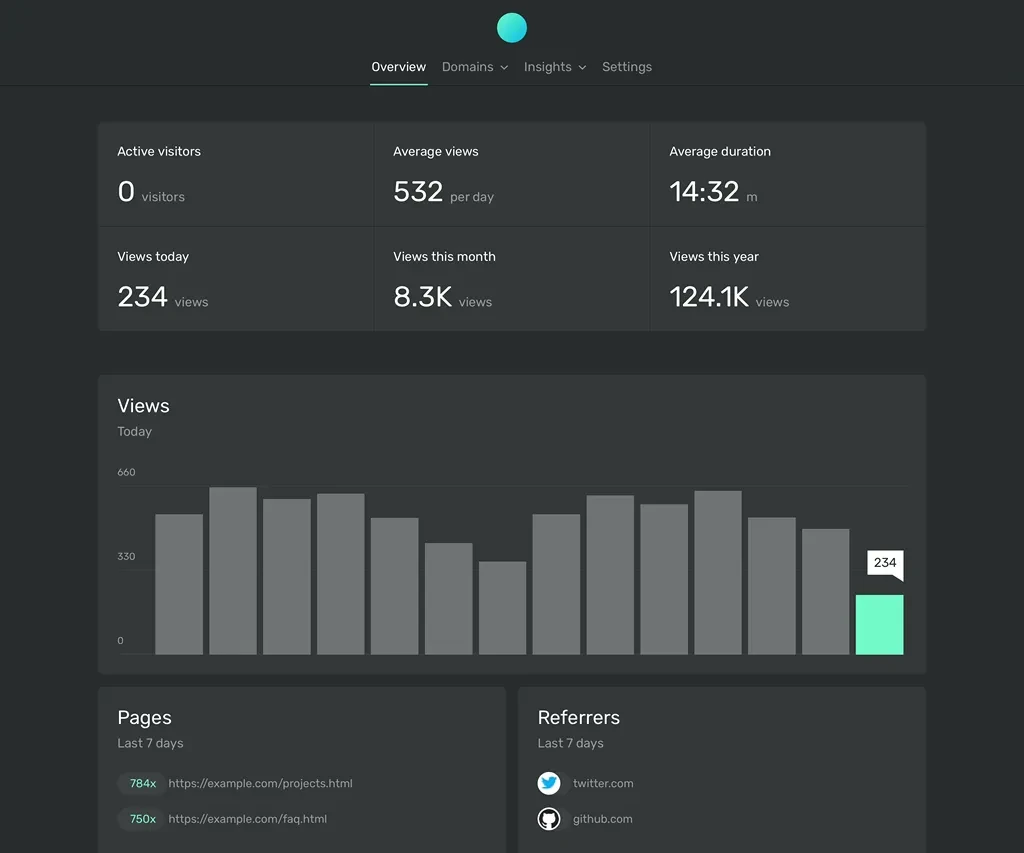
Ackee is a privacy-focused analytics solution that operates on your own server, eliminating the need for third-party tracking. Built on Node.js, it provides in-depth analysis of your website traffic and presents the data in a clean and minimal interface.
What I like
I like Ackee because it is free and open-source, meaning users can host it on their own server and manage their data. It also has a real-time visitor monitoring feature which is great. The dashboard is easy to use. However, there is no way to compare analytics data, so it can be hard to get a full view of website performance.
What I don’t like
Ackee has some drawbacks. It's self-hosted only, so you have to deal with technical stuff which can be difficult. I had trouble setting it up too, as it wouldn't collect tech metrics like devices, OS, and browser. My Ackee setup also didn't collect visitor data correctly, so I had to stop using it after just a few days. That why I can't compare Ackee accuracy to Google Analytics.
Technical detail
From a technical perspective, Ackee adds 2 HTTP requests (0.321 KB) and 2 additional HTTP requests (288 B) every 15 seconds as long as someone is viewing a page. This adds a small amount of extra load to your website, but it is not significant.
Ackee has some useful features, but it may not be a good fit for everyone.
Ackee
Pricing: Free.
Hosting: Self-host.
Source code: Open source.
Official site: https://ackee.electerious.com/.
Cabin
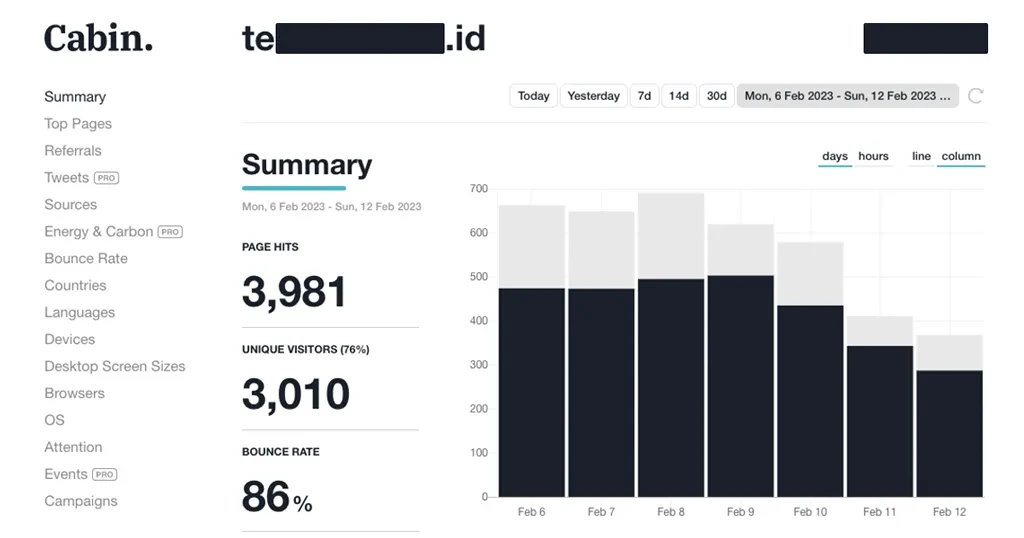
Cabin is a privacy-focused, carbon-conscious web analytics solution. It's lightweight and compliant with all known privacy laws, making it the ideal cookie-free alternative to Google Analytics.
What I Like
One of the things that I like about Cabin is how the data is presented in the dashboard, it is easy to understand and well-designed.
What I don’t like
However, there are a few downsides to using Cabin. It is hosted only, meaning you don't have full control over the data collected. Additionally, there is no real-time visitor monitoring feature or way to compare analytics data over time, which may not be suitable for everyone. Furthermore, the free version only retains data for 30 days.
Technical detail
From a technical standpoint, Cabin adds 3 HTTP requests at 0.204 KB, it is relatively minimal.
Data accuracy
When comparing the data collected by Cabin to Google Analytics for visitor and page views data from January 2 to 8, 2023, I found that the deviation in accuracy for visitor data was relatively small at 2.14%. This suggests that the number of visitors reported by Cabin is slightly higher than the number reported by Google Analytics, but the difference is minimal.
| Visitor Date | Jan 2 | Jan 3 | Jan 4 | Jan 5 | Jan 6 | Jan 7 | Jan 8 | Jan 2-8 |
|---|---|---|---|---|---|---|---|---|
| Cabin | 405 | 480 | 488 | 461 | 409 | 260 | 262 | 2765 |
| Google Analytics | 389 | 469 | 483 | 461 | 401 | 247 | 257 | 2707 |
| Deviation (%) | 4.11% | 2.35% | 1.04% | 0.00% | 2.00% | 5.26% | 1.95% | 2.14% |
The difference in accuracy for page views data was small, at 5.28%. This means that the page views reported by Cabin were a bit higher than the ones reported by Google Analytics, but not much.
| Page Views Date | Jan 2 | Jan 3 | Jan 4 | Jan 5 | Jan 6 | Jan 7 | Jan 8 | Jan 2-8 |
|---|---|---|---|---|---|---|---|---|
| Cabin | 494 | 643 | 672 | 597 | 561 | 308 | 336 | 3611 |
| Google Analytics | 472 | 627 | 643 | 548 | 522 | 295 | 323 | 3430 |
| Deviation (%) | 4.66% | 2.55% | 4.51% | 8.94% | 7.47% | 4.41% | 4.02% | 5.28% |
It is worth noting that both analytics tools use different terms. Google Analytics uses the term "users" as visitors (I assume) while Cabin uses "Unique Visitors". Google Analytics uses "page views" while Cabin uses "page hits" (I assume it equates to page views). Despite the slight differences in terminology, the overall data collected by both tools was very similar.
In terms of accuracy, I can accept how Cabin performs and may consider it as a replacement for Google Analytics. However, it is important to note that the deviation in accuracy may vary depending on the website and the data being collected. It is important to conduct your own testing and analysis to determine if Cabin is a suitable replacement for your specific needs.
While there are some slight differences in terminology and features between Cabin and Google Analytics, the data collected by both tools is relatively similar, with small deviations in accuracy for visitor and page views data.
In summary, Cabin offers a user-friendly and well-designed dashboard, but it may not be the best fit for everyone due to its hosted-only nature and lack of real-time visitor monitoring and data comparison capabilities.
Cabin
Pricing: Freemium, Pro plan start USD 19 per month.
Hosting: Hosted.
Source code: Proprietary.
Official site: https://withcabin.com/.
Cloudflare Web Analytics
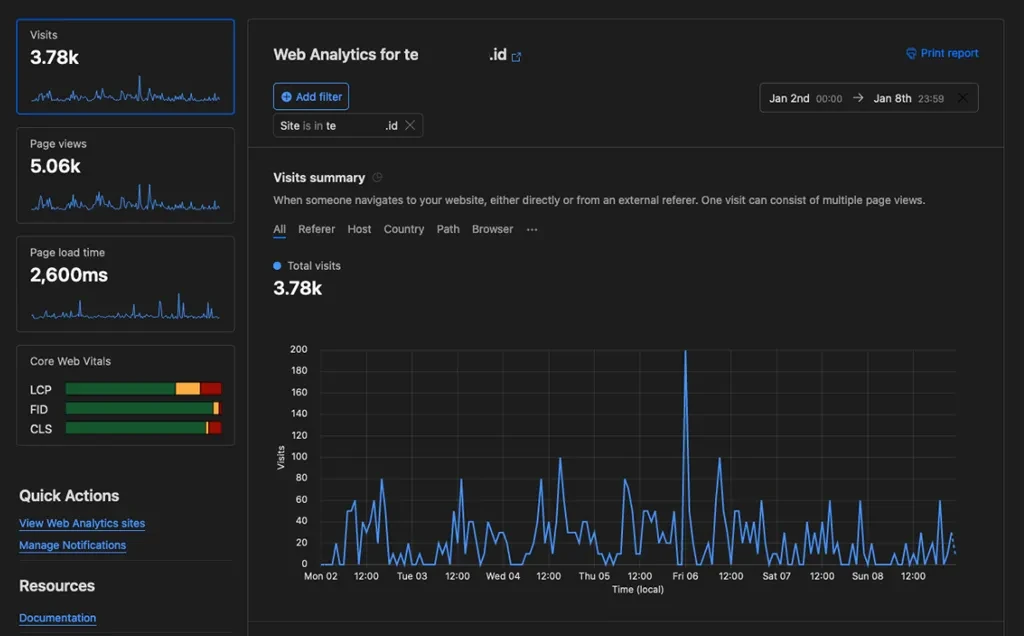
Cloudflare Web Analytics is a free, privacy-first analytics tool for websites that does not require changing DNS or using Cloudflare's proxy. It helps users understand the performance of web pages as experienced by site visitors, without collecting or using personal data.
What I like
One of the things I like about Cloudflare Web Analytics is that it's free, also measures site performance, presents data in an easy-to-understand dashboard, and has an automatic setup when your site is also in the Cloudflare DNS.
What I don’t like
However, it may not be suitable for everyone because it is hosted only, there is no way to compare data over time, and no live visitor monitoring. One thing I don't like is that Cloudflare rounds the number with "K" when your visitor or page views count is more than 1000. It may look good on display, but for accuracy, I prefer using full numbers.
Technical detail
From a technical perspective, Cloudflare Analytics adds only 1 HTTPS request at 6.4 KB, which is minimal and won't add much load to your website.
Data accuracy
Upon comparing the visitor and page views data from January 2 to 8, 2023, collected by Cloudflare Web Analytics with that of Google Analytics, I found that the accuracy was hit and miss. Sometimes it would overcount and sometimes it would undercount, which is a huge drawback for me and I am not sure why the count is so different.
From the 7 days of testing, Cloudflare Web Analytics counted 3780 visitors while Google Analytics counted 2707. This means that Cloudflare Web Analytics counted 38.72% higher.
| Visitor Date | Jan 2 | Jan 3 | Jan 4 | Jan 5 | Jan 6 | Jan 7 | Jan 8 | Jan 2-8 |
|---|---|---|---|---|---|---|---|---|
| Cloudflare Web Analytics | 540 | 450 | 690 | 630 | 860 | 380 | 230 | 3780 |
| Google Analytics | 389 | 469 | 483 | 461 | 401 | 247 | 257 | 2707 |
| Deviation (%) | 38.82% | -4.05% | 42.86% | 36.66% | 114.46% | 53.85% | -10.51% | 39.64% |
For page views data, Cloudflare Web Analytics counted 5060 page views while Google Analytics counted 3430, which is 43.74% higher.
| Page Views Date | Jan 2 | Jan 3 | Jan 4 | Jan 5 | Jan 6 | Jan 7 | Jan 8 | Jan 2-8 |
|---|---|---|---|---|---|---|---|---|
| Cloudflare Web Analytics | 690 | 690 | 1100 | 780 | 1120 | 390 | 290 | 5060 |
| Google Analytics | 472 | 627 | 643 | 548 | 522 | 295 | 323 | 3430 |
| Deviation (%) | 46.19% | 10.05% | 71.07% | 42.34% | 114.56% | 32.20% | -10.22% | 47.52% |
It is worth noting that on January 8, Cloudflare Web Analytics counted visitors -10.52% lower than Google Analytics and page views -10.22% lower. This is very strange, and I am not sure how to explain it.
It may take more time and data to make a conclusive statement about Cloudflare Web Analytics accuracy. However, based on my short test, I am not impressed with its accuracy.
Cloudflare Web Analytics is an excellent choice for individuals seeking a privacy-focused, no-cost analytics solution. However, it may not be suitable for everyone since it is only available as a hosted service, and it lacks features such as data comparison and real-time visitor monitoring.
Cloudflare Web Analytics
Pricing: Free.
Hosting: Hosted.
Source code: Proprietary.
Official site: https://www.cloudflare.com/web-analytics/.
Fathom Analytics
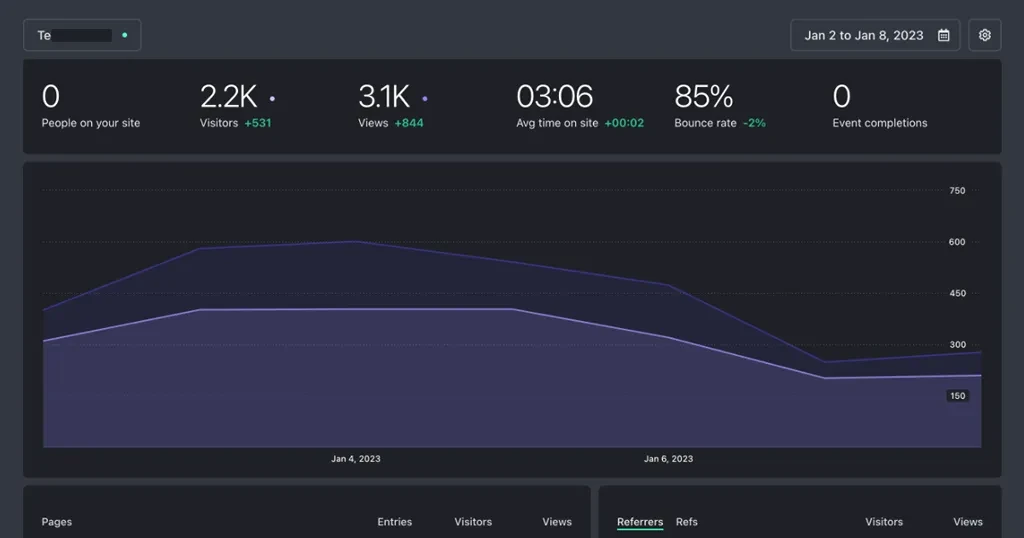
Fathom Analytics is a privacy-focused alternative to Google Analytics that does not track personal data. It has a strong focus on privacy, including compliance with privacy laws and a dedicated privacy officer.
Fathom Analytics pricing is based on page views. It starts at $14 per month for up to 100,000 monthly page views across up to 50 sites, with a 30-day full-feature trial.
Fathom Analytics has a self-hosted version called Fathom Lite, which is available as an option for users who can manage the technical setup.
What I like
I like that Fathom Analytics is simple, with all data presented on a single page dashboard and it supports live visitor monitoring. However, it does not have a way to compare data over time.
What I don’t like
One thing I don't like is that it uses "K" rounding when the number reaches 1000. I can't recall if it can be turned off or not.
Technical detail
Technically speaking, Fathom Analytics introduces 2 HTTP payloads, totaling 0.429 KB, which is a negligible addition and should not significantly impact your website's load time.
Data accuracy
When comparing the visitor and page views data from January 2 to 8, 2023, collected by Fathom Analytics with that of Google Analytics, I found that Fathom Analytics counted visitors lower than Google Analytics at -16.99%.
| Visitor Date | Jan 2 | Jan 3 | Jan 4 | Jan 5 | Jan 6 | Jan 7 | Jan 8 | Jan 2-8 |
|---|---|---|---|---|---|---|---|---|
| Fathom Analytics | 310 | 401 | 403 | 403 | 320 | 201 | 209 | 2247 |
| Google Analytics | 389 | 469 | 483 | 461 | 401 | 247 | 257 | 2707 |
| Deviation (%) | -20.31% | -14.50% | -16.56% | -12.58% | -20.20% | -18.62% | -18.68% | -16.99% |
The page views count was also lower at -9.04%. Although it undercounted, I didn't find any strange discrepancies like I did with Cloudflare.
| Page Views Date | Jan 2 | Jan 3 | Jan 4 | Jan 5 | Jan 6 | Jan 7 | Jan 8 | Jan 2-8 |
|---|---|---|---|---|---|---|---|---|
| Fathom Analytics | 400 | 580 | 601 | 541 | 473 | 248 | 277 | 3120 |
| Google Analytics | 472 | 627 | 643 | 548 | 522 | 295 | 323 | 3430 |
| Deviation (%) | -15.25% | -7.50% | -6.53% | -1.28% | -9.39% | -15.93% | -14.24% | -9.04% |
It's possible that Fathom Analytics uses a different method of counting analytics data compared to Google Analytics, which could explain the difference in numbers. However, I cannot confirm this without further investigation.
While Fathom Analytics may undercount visitors and page views compared to Google Analytics, it still provides accurate data and can be considered as an alternative.
Overall, Fathom Analytics is a good option for those looking for a privacy-focused, simple and easy to use analytics tool, but it may not be the best fit for everyone due to its lack of data comparison capabilities.
Fathom Analytics
Pricing: Start from USD 14 per month with 30 day free trial.
Hosting: Hosted, with self-hosted option called Fathom Lite.
Source code: The hosted version is proprietary, while the self-host is open sources.
Official site: https://usefathom.com/.
GoatCounter
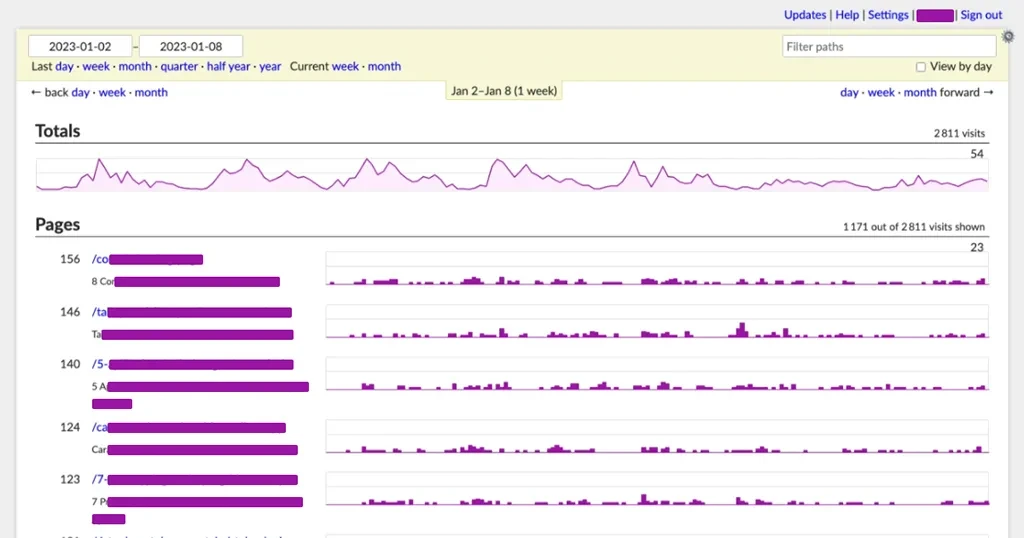
GoatCounter is a privacy-friendly web analytics platform that can be used as a hosted service or self-hosted app, providing an alternative to Google Analytics or Matomo with an emphasis on ease of use and meaningful data.
What I like
I like that GoatCounter is free and open-source, and it can be used as a hosted service so there's no need to take care of technical setup. It also supports self-hosting for users who prefer to handle the technical aspects themselves.
What I don’t like
However, I don't like that it doesn't have live visitor monitoring and doesn't have a way to compare data over time. Additionally, the way the data is presented is different and may require a learning curve to understand it.
Technical detail
From a technical standpoint, GoatCounter introduces just 1 HTTP payload, amounting to 0.810 KB, which is a small addition and should not significantly increase the load time of your website.
Data accuracy
Comparing GoatCounter's visitor and page views data from January 2 to 8, 2023, with that of Google Analytics, I found that GoatCounter counted visitors as many as 2811 while Google Analytics counted 2707, which is 3.85% higher. However, when looking at the data day by day, I noticed that GoatCounter sometimes overcounted and sometimes undercounted.
| Visitor Date | Jan 2 | Jan 3 | Jan 4 | Jan 5 | Jan 6 | Jan 7 | Jan 8 | Jan 2-8 |
|---|---|---|---|---|---|---|---|---|
| GoatCounter | 362 | 508 | 552 | 492 | 415 | 233 | 249 | 2811 |
| Google Analytics | 389 | 469 | 483 | 461 | 401 | 247 | 257 | 2707 |
| Deviation (%) | -6.94% | 8.32% | 14.29% | 6.72% | 3.49% | -5.67% | -3.11% | 3.84% |
GoatCounter also records page views but represents them for each page individually, rather than aggregating them by a certain period. This makes it difficult to know the number of page views for a specific day or week.
Although GoatCounter may offer slightly higher visitor counts than Google Analytics, it lacks the same level of detail and precision. Analyzing the data and extracting meaningful insights may require more time and effort.
In general, GoatCounter is a suitable choice for individuals seeking a free and open-source web analytics tool. However, due to its absence of live visitor monitoring and data comparison capabilities, it may not be the most appropriate option for everyone.
GoatCounter
Pricing: Free for non-commercial use.
Hosting: Hosted, self-hosted.
Source code: Open sources.
Official site: https://www.goatcounter.com/.
Jetpack Stats
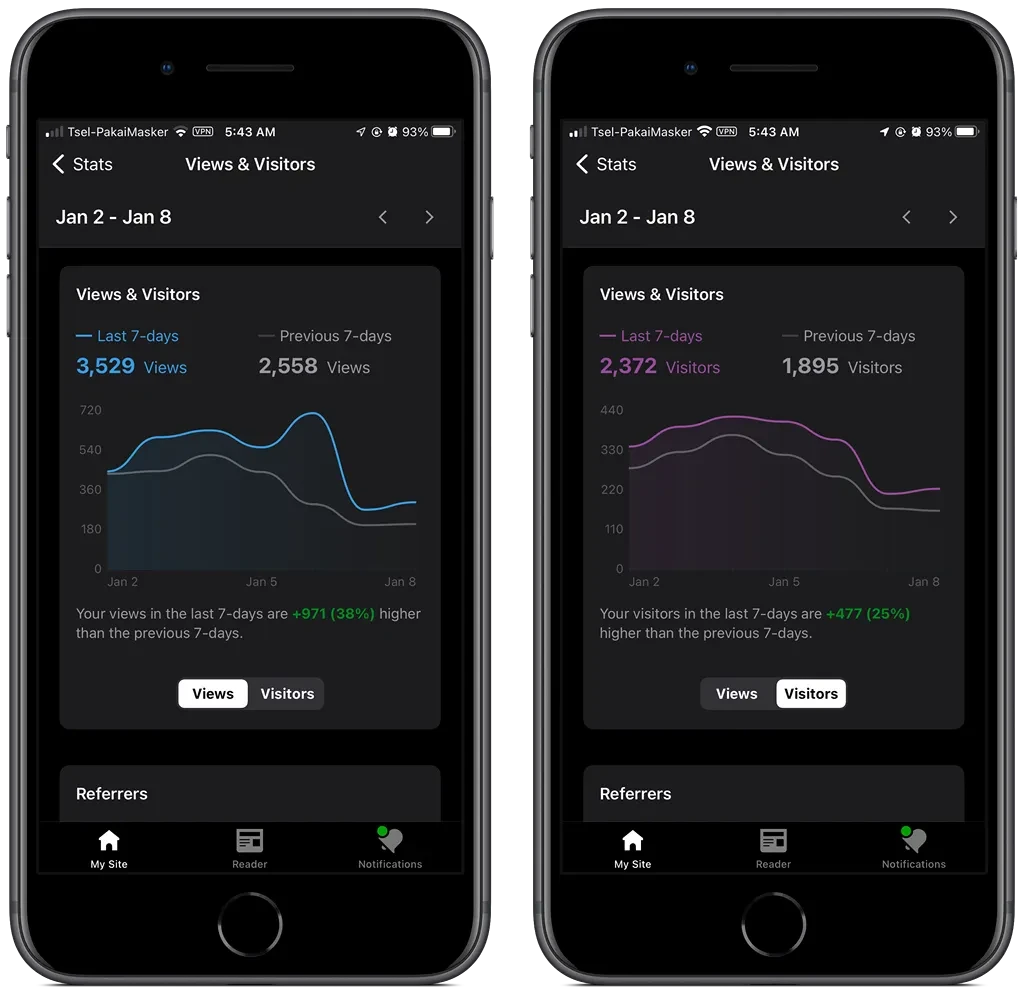
Jetpack Stats is a website analytics solution designed for WordPress-based websites. It provides clear and concise statistics on visitors and traffic, with easy one-click setup and installation. It also offers key insights on popular times, geographic locations, and search terms used to find your website, and is available on mobile devices through Jetpack app.
What I like
I like that Jetpack Stats is free, easy to set up, and provides key insights into the performance of my WordPress-based website. Additionally, I appreciate the fact that it is available on mobile devices and that it provides me with clear and concise statistics on visitors and traffic.
What I don’t like
However, I don't like that Jetpack Stats is WordPress-only, and that I need to use the Jetpack plugin, which can be quite bloated. Additionally, some bot traffic is not filtered out, which can lead to spikes in page views.
Technical detail
Technically, Jetpack Stats introduces two HTTP payloads totaling 3.275 KB, which is a relatively minor addition and should not significantly impact your website's load.
Data accuracy
Comparing Jetpack Stats' visitor and page views data from January 2 to 8, 2023, with that of Google Analytics I found that Jetpack Stats counted visitors lower than Google Analytics at -12.38%.
| Visitor Date | Jan 2 | Jan 3 | Jan 4 | Jan 5 | Jan 6 | Jan 7 | Jan 8 | Jan 2-8 |
|---|---|---|---|---|---|---|---|---|
| Jetpack Stats | 342 | 397 | 425 | 411 | 361 | 211 | 225 | 2372 |
| Google Analytics | 389 | 469 | 483 | 461 | 401 | 247 | 257 | 2707 |
| Deviation (%) | -12.08% | -15.35% | -12.01% | -10.85% | -9.98% | -14.57% | -12.45% | -12.38% |
When looking at the data day by day, it seemed that there were no strange discrepancies. Jetpack may use a different method to count visitors than Google Analytics.
The difference in accuracy for page views data was less significant, at -2.98%. However, there was one strange occurrence on January 6, when Jetpack Stats counted page views 36.21% higher than Google Analytics.
| Page Views Date | Jan 2 | Jan 3 | Jan 4 | Jan 5 | Jan 6 | Jan 7 | Jan 8 | Jan 2-8 |
|---|---|---|---|---|---|---|---|---|
| Jetpack Stats | 447 | 602 | 633 | 556 | 711 | 273 | 307 | 3529 |
| Google Analytics | 472 | 627 | 643 | 548 | 522 | 295 | 323 | 3430 |
| Deviation (%) | -5.30% | -3.99% | -1.56% | 1.46% | 36.21% | -7.46% | -4.95% | 2.89% |
This is because I had set up Ahrefs to scan my site every Friday, and it appears that Jetpack Stats could not filter out the AhrefsBot from the page views count. Jetpack Stats does not have a setting to filter out bots, so this is something to be aware of.
Jetpack Stats may tally visitors and page views differently than Google Analytics, and this may result in data discrepancies. It is important to understand the data collected by both tools and to be aware of the differences in accuracy.
Overall, Jetpack Stats is a suitable choice for individuals seeking a website analytics solution for WordPress-based websites. However, due to its exclusive WordPress nature and inadequate bot traffic filtering, it may not be the most appropriate option for everyone.
Jetpack Stats
Pricing: Free.
Hosting: Hosted.
Source code: Open sources.
Official site: https://jetpack.com/.
Matomo
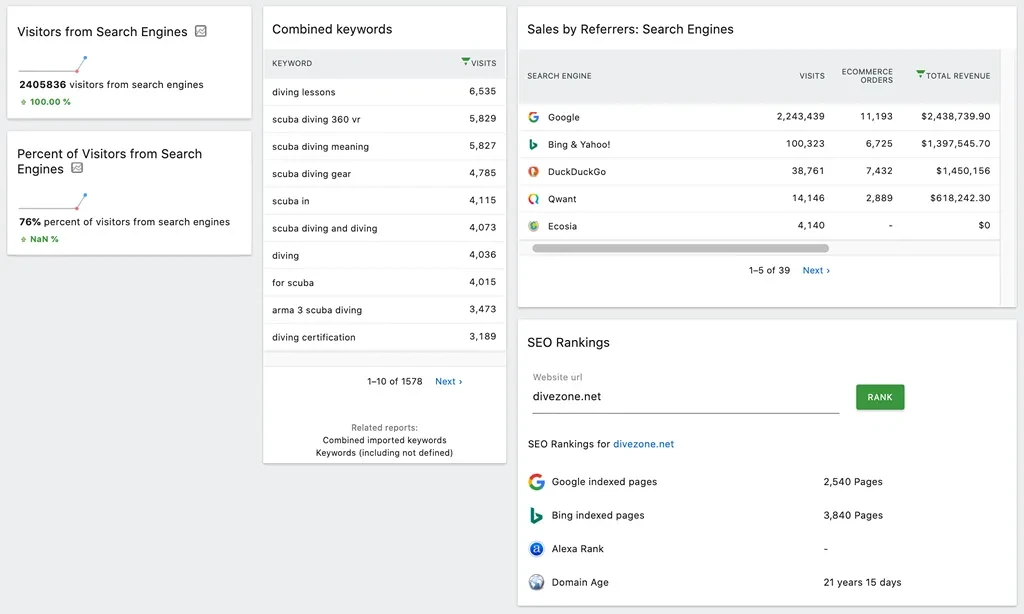
Matomo is a feature-rich web analytics platform that can be compared head-to-head with Google Analytics. It offers almost all the same features as Google Analytics and is extremely flexible in terms of hosting. You can self-host Matomo or use the hosted Matomo Cloud solution.
If you're looking for a privacy-focused alternative to Google Analytics but don't want to lose the features that Google Analytics offers, Matomo is a great choice.
What I like
I wasn't particularly impressed with Matomo when I tried it out. One thing I liked about it was that it offers the option to self-host, but overall it didn't seem like a good fit for me.
What I don’t like
The dashboard was difficult for me to navigate and understand, and I found that I didn't need all the features it offered. It felt like just another version of Google Analytics with different technology.
Technical detail
In terms of technical details, Matomo adds 2 additional HTTP requests at 40.629 KB, which is the heaviest in this list. However, it is only 10% compared to the payload of Google Analytics at 408.155 KB with 8-12 HTTP requests, depending on your Google Analytics settings.
This may not be a concern for some users, but for those who are looking for a lightweight solution, Matomo may not be the best choice. Keep in mind that Matomo is a feature-rich platform that may not be necessary for everyone to use all of its features.
Data accuracy
Unfortunately, I did not record the daily data before my Matomo trial expired, so I cannot provide day-to-day data like the other options on this list. Matomo also does not allow exporting data after the trial ends. However, I do have weekly aggregate data from email reports.
Comparing data from January 2 to 8, 2023, Matomo counted 2668 visitors while Google Analytics counted 2707, which is only a 1.44% difference.
| Visitor Date | Jan 2-8 |
|---|---|
| Matomo | 2668 |
| Google Analytics | 2707 |
| Deviation (%) | -1.44% |
For page views, Matomo counted 3592 while Google Analytics counted 3430, which is a 4.72% difference.
| Page Views Date | Jan 2-8 |
|---|---|
| Matomo | 3592 |
| Google Analytics | 3430 |
| Deviation (%) | 4.72% |
Without being able to view data on a daily basis, it's hard to identify any irregularities or discrepancies, but I think its accuracy may differ slightly from Google Analytics.
In conclusion, Matomo is a feature-rich web analytics platform that offers almost all of the same features as Google Analytics and is extremely flexible in terms of hosting. It's a great choice for those looking for a privacy-focused alternative to Google Analytics but don't want to lose the features that Google Analytics offers.
Matomo may not be the best fit for me but it's worth considering for those looking for a privacy-focused alternative to Google Analytics.
Matomo
Pricing: Free for self-host, the hosted Cloud plan start USD 23 per month.
Hosting: Hosted, self-host.
Source code: Open sources.
Official site: https://matomo.org/.
Microanalytics
Microanalytics is a web analytics alternative founded by a team of indie developers that focuses on privacy and compliance with GDPR, PECR, and CCPA regulations, providing users with an easy to use and secure analytics solution.
It was the first privacy conscious analytics platform I tried before trying the rest on this list that ended up in comparing all of them.
What I like
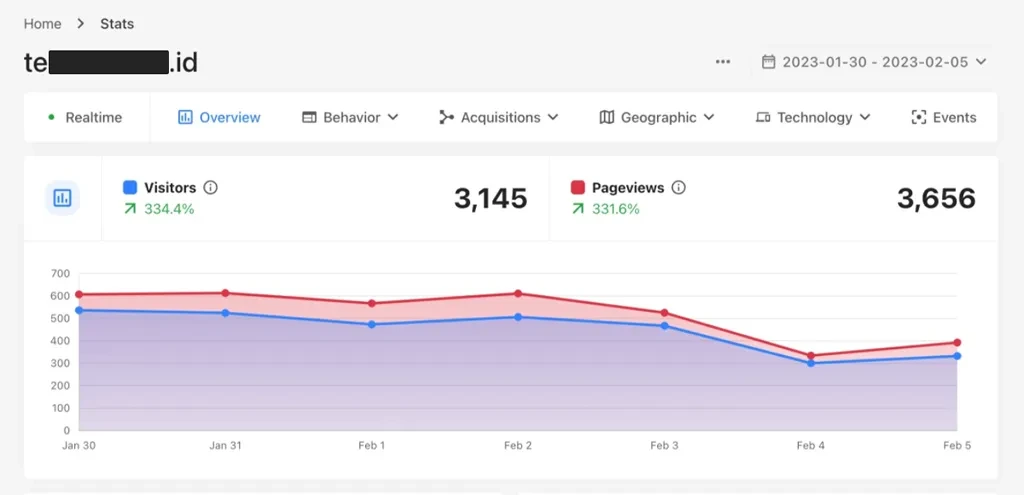
I like that Microanalytics offers a free version, with a well-designed dashboard that is easy to understand and use. Additionally, it supports sharing the dashboard publicly, which is great if you want to share your analytics with others, and it supports live visitor monitoring, so you can see who is visiting your website in real-time.
What I don’t like
Since the domain name includes the word "analytics", this has caused some tracker protection services, such as those used to filter out Google Analytics, to block Microanalytics. I have sometimes encountered an error message stating that the DNS could not find the server when attempting to open the website.
Technical detail
From a technical standpoint, Microanalytics adds 3 HTTP payloads, totaling 1.3 KB. This is a relatively small amount and should not significantly increase the load time of your website.
Data accuracy
I retested Microanalytics at a different time than the other analytics on this list, as I had lost my data during the initial test.
For the period of January 30 to February 5, 2023, Microanalytics reported 3145 visitors which was 12.68% higher than Google Analytics, which counted 2791 visitors. However, when looking at the day-to-day data, the accuracy of Microanalytics becomes somewhat inconsistent. The most accurate comparison to Google Analytics was recorded at 4.64% while the highest discrepancy was 17.12%.
| Visitor Date | Jan 30 | Jan 31 | Feb 1 | Feb 2 | Feb 3 | Feb 4 | Feb 5 | Jan 30 - Feb 5 |
|---|---|---|---|---|---|---|---|---|
| Microanalytics | 537 | 525 | 474 | 507 | 468 | 301 | 333 | 3145 |
| Google Analytics | 478 | 454 | 453 | 437 | 408 | 257 | 304 | 2791 |
| Deviation (%) | 12.34% | 15.64% | 4.64% | 16.02% | 14.71% | 17.12% | 9.54% | 12.68% |
The page views data for the same period showed that Microanalytics counted 3656 page views, which was nearly as accurate as Google Analytics at 2.29%. However, the day-to-day accuracy for page views also varied, with the most accurate comparison recorded at 0.77% and the least accurate at -7.34% with a highest discrepancy of 10.56%.
| Page Views Date | Jan 30 | Jan 31 | Feb 1 | Feb 2 | Feb 3 | Feb 4 | Feb 5 | Jan 30 - Feb 5 |
|---|---|---|---|---|---|---|---|---|
| Microanalytics | 608 | 614 | 568 | 612 | 526 | 335 | 393 | 3656 |
| Google Analytics | 582 | 588 | 613 | 582 | 522 | 303 | 384 | 3574 |
| Deviation (%) | 4.47% | 4.42% | -7.34% | 5.15% | 0.77% | 10.56% | 2.34% | 2.29% |
In general, Microanalytics is an excellent alternative for those seeking a privacy-conscious and compliant analytics solution. The user-friendly dashboard, live visitor monitoring, and public sharing feature make it an attractive option. However, the page views cap may restrict some users who want to explore the product more before deciding to upgrade.
Microanalytics
Pricing: Free for 5K page views per month, paid plan start at USD 9 per month.
Hosting: Hosted.
Source code: Proprietary.
Official site: https://microanalytics.io/.
Plausible Analytics
Plausible Analytics is a simple and privacy-friendly alternative to Google Analytics. It is a lightweight and open source solution with no cookies and full compliance with GDPR, CCPA, and PECR regulations. Made and hosted in the EU, powered by European cloud infrastructure.
What I like
I like that Plausible Analytics has a hosted and self-hosted option, with the self-hosted version being near identical to the hosted version. This is different from other alternatives like Fathom Lite that only provide essential features compared to the hosted version.
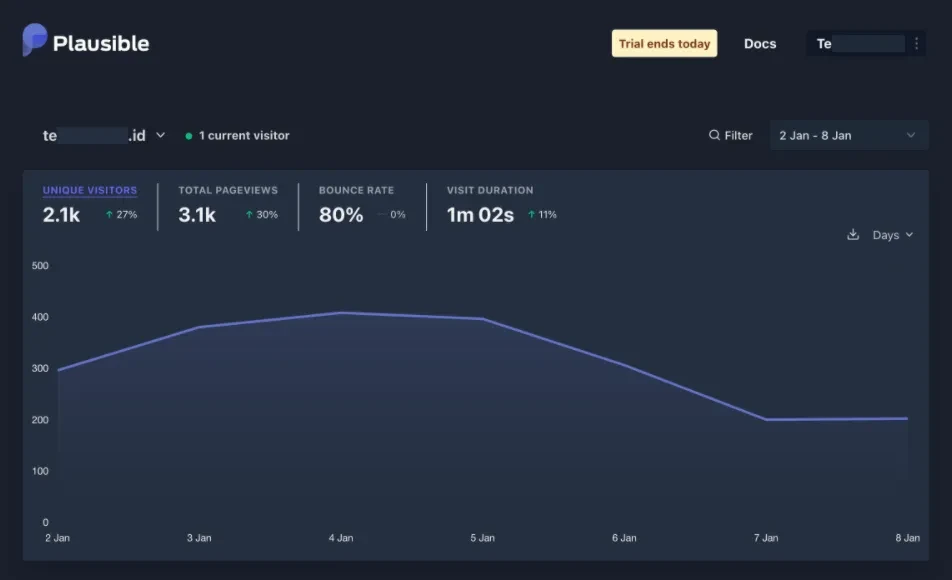
Additionally, it starts at just USD 9 per month, making it and Microanalytics the most affordable option on this list. Plausible also offers real-time visitor monitoring and has an integration with Google Search Console, which is extremely useful for SEO.
What I don’t like
What I don’t like about Plausible Analytics is that, like other alternatives on the list, it does not have a feature to compare data over time. Also, it rounds numbers with “K” which can make the accuracy a bit less precise. I can’t recall if it is possible to change it to full numbers.
Technical details
In terms of technical details, Plausible Analytics adds only 1 HTTP request to your website at 0.487 KB. This makes it lightweight and efficient, ensuring that it won't slow down your website's performance.
Data accuracy
In terms of accuracy compared to Google Analytics, my data shows that Plausible Analytics undercounts both visitors and page views.
From January 2nd to January 8th, Plausible counted 2195 visitors, which is 18.91% lower than the 2707 visitors counted by Google Analytics.
| Visitor Date | Jan 2 | Jan 3 | Jan 4 | Jan 5 | Jan 6 | Jan 7 | Jan 8 | Jan 2-8 |
|---|---|---|---|---|---|---|---|---|
| Plausible | 297 | 381 | 409 | 397 | 307 | 201 | 203 | 2195 |
| Google Analytics | 389 | 469 | 483 | 461 | 401 | 247 | 257 | 2707 |
| Deviation (%) | -23.65% | -18.76% | -15.32% | -13.88% | -23.44% | -18.62% | -21.01% | -18.91% |
When looking at the day-to-day data, Plausible consistently undercounts at varied levels, with the lowest being a 23.65% discrepancy and the highest being a 13.88% discrepancy.
Similarly, Plausible counted 3150 page views, which is 8.16% lower than the 3430 page views recorded by Google Analytics.
| Page Views Date | Jan 2 | Jan 3 | Jan 4 | Jan 5 | Jan 6 | Jan 7 | Jan 8 | Jan 2-8 |
|---|---|---|---|---|---|---|---|---|
| Plausible | 390 | 567 | 611 | 547 | 502 | 257 | 276 | 3150 |
| Google Analytics | 472 | 627 | 643 | 548 | 522 | 295 | 323 | 3430 |
| Deviation (%) | -17.37% | -9.57% | -4.98% | -0.18% | -3.83% | -12.88% | -14.55% | -8.16% |
The day-to-day data for page views showed inconsistent results, with some days showing accurate counts similar to Google Analytics and others showing lower counts.
In conclusion, Plausible Analytics offers a simple and privacy-friendly alternative to Google Analytics, being lightweight and open source, and fully compliant with privacy regulations like GDPR, CCPA, and PECR.
Its self-hosted option and affordable pricing make it an attractive option for many. However, it has been found to be less accurate compared to Google Analytics in terms of visitor and page views tracking.
Despite this, it still remains a viable option for those looking for a more privacy-conscious and cost-effective analytics solution.
Plausible Analytics
Pricing: Start from USD 9 per month with 30 day free trial.
Hosting: Hosted, with option to self-host.
Source code: Open sources.
Official site: https://plausible.io/.
Simple Analytics
Simple Analytics is a privacy-first Google Analytics alternative that offers a straightforward and uncomplicated solution for website analytics. Based and hosted in the EU, it is fully compliant with privacy laws and does not use cookies, ensuring the protection of users' data.
With its simple and user-friendly approach, Simple Analytics is a great choice for those looking for a hassle-free analytics solution.
What I like
I like that Simple Analytics has a simple and user-friendly dashboard that is easy to understand. Additionally, it offers real-time visitor monitoring, which allows you to track visitors in real-time, and it is the only one on this list that offers a 1-year free plan for students, teachers, and faculty members through the Github Student Developer Pack. This is a great way for academics to access Simple Analytics without having to pay.
What I don’t like
Note that Simple Analytics is hosted only, so you cannot self-host the solution and must rely on Simple Analytics to host your data. Additionally, like the other alternatives on this list, Simple Analytics does not have a feature to compare data over time.
While its pricing is competitive, Cabin, Fathom, Plausible, and Microanalytics offer more cost-effective options for those needing to track multiple websites. Cabin offers unlimited website tracking for the same price, while Fathom supports up to 50 websites and is priced lower. Plausible allows use on up to 50 websites for the same price, and Microanalytics offers unlimited website tracking starting from USD 9 per month. Since all five tools have similar features, it is worthwhile to evaluate which one offers the best value for your specific needs.
Technical details
Simple Analytics adds 2 HTTP payloads at 4.039 KB, which is a relatively small size from a technical perspective and won't significantly increase the load time of your website.
Data accuracy
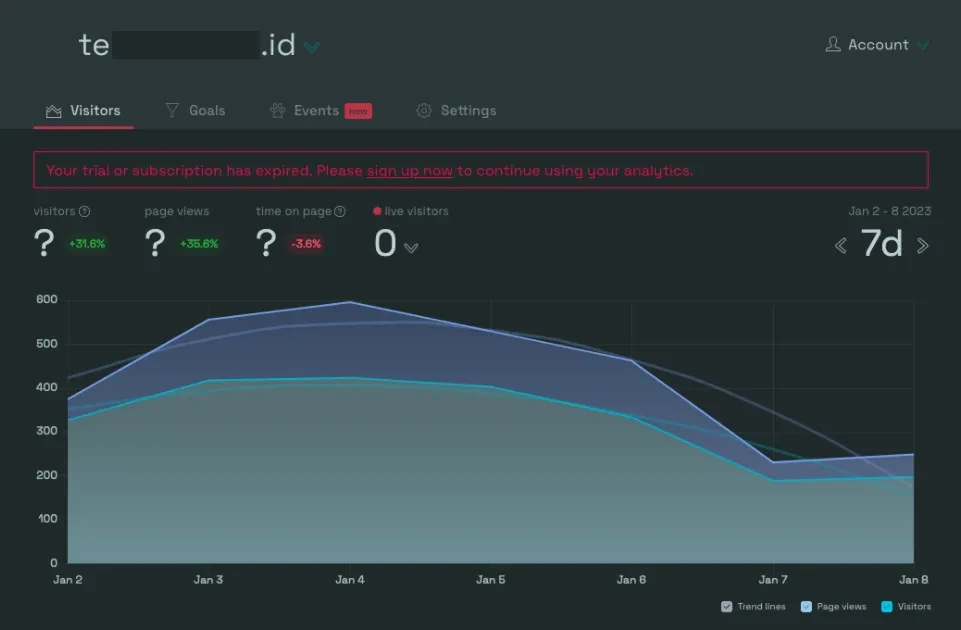
From January 2nd to January 8th, Simple Analytics counted 2293 visitors, which was 15.29% lower than the 2707 visitors counted by Google Analytics. However, the day to day data looks consistent with no extreme deviation.
| Visitor Date | Jan 2 | Jan 3 | Jan 4 | Jan 5 | Jan 6 | Jan 7 | Jan 8 | Jan 2-8 |
|---|---|---|---|---|---|---|---|---|
| Simple Analytics | 327 | 418 | 424 | 403 | 334 | 189 | 198 | 2293 |
| Google Analytics | 389 | 469 | 483 | 461 | 401 | 247 | 257 | 2707 |
| Deviation (%) | -15.94% | -10.87% | -12.22% | -12.58% | -16.71% | -23.48% | -22.96% | -15.29% |
For the same period, Simple Analytics counted 3000 page views, which was 12.54% lower than the 3430 page views recorded by Google Analytics.
| Page Views Date | Jan 2 | Jan 3 | Jan 4 | Jan 5 | Jan 6 | Jan 7 | Jan 8 | Jan 2-8 |
|---|---|---|---|---|---|---|---|---|
| Simple Analytics | 375 | 556 | 596 | 530 | 463 | 231 | 249 | 3000 |
| Google Analytics | 472 | 627 | 643 | 548 | 522 | 295 | 323 | 3430 |
| Deviation (%) | -20.55% | -11.32% | -7.31% | -3.28% | -11.30% | -21.69% | -22.91% | -12.54% |
When examining the daily page views data, Simple Analytics consistently underestimated the numbers, ranging from 3.28% to 22.91%. The discrepancies between Simple Analytics and Google Analytics varied, with some days showing accurate counts and others showing lower numbers.
Overall, Simple Analytics is a great choice for those looking for a hassle-free analytics solution. Its simple and user-friendly dashboard, real-time visitor monitoring, and free plan for students are attractive features. However, it has been found to be less accurate compared to Google Analytics in terms of visitor and page views tracking.
Simple Analytics
Pricing: Start from USD 19 per month with 14 day free trial.
Hosting: Hosted.
Source code: Proprietary.
Official site: https://www.simpleanalytics.com/.
Umami
Umami is a privacy-focused and fast alternative to Google Analytics, offering simple and user-friendly analytics. Similar to Ackee, Umami originated as a self-hosted analytics solution that prioritizes its users' privacy.
The developer of Umami is currently developing its cloud version, which is still in beta. In this test, I used the self-hosted version 1.39.0, which has since been updated to version 1.40.0. The Umami Cloud uses version 2.0.0-beta.2.
Initially, I tried both the self-hosted and cloud versions. However, I discovered that the Umami cloud version did not accurately record site data when compared to the self-hosted version. As a result, I decided to abandon the cloud version and focused my testing on the self-hosted version that I had personally set up.
What I like
Umami is a great analytics solution for those who value privacy and simplicity. It is open source, self-hosted, and has a hosted version currently in development, providing users with full control over their data.
The real-time monitoring capability allows users to see their analytics data update in real-time, providing a more accurate and up-to-date view of their website traffic.
The clean and beautiful design of the dashboard makes it easy to understand and navigate, making it simple for users to access and view their analytics data. Overall, I highly recommend Umami for those who value privacy, simplicity, and real-time monitoring.
What I don’t like
While I appreciate the privacy and simplicity offered by Umami, there are a few things that I don't like about the product. Firstly, I have found that Umami generally undercounts visitor data and overcounts page views by a significant margin. This can be seen in the data accuracy section and is a major concern for me.
Additionally, the cloud version of Umami is not currently recording site data correctly. While I understand that it is still in development, this has left a negative first impression on me and has made me hesitant to fully embrace the product. I am hopeful that the cloud version will perform better when it is finally launched, but for now, it remains a concern for me.
Technical details
From a technical standpoint, Umami has a minimal impact on your website as it only adds 5 HTTP payloads that weigh in at a total of 3.31 KB. This is relatively small and will not add significant load to your website.
Data accuracy
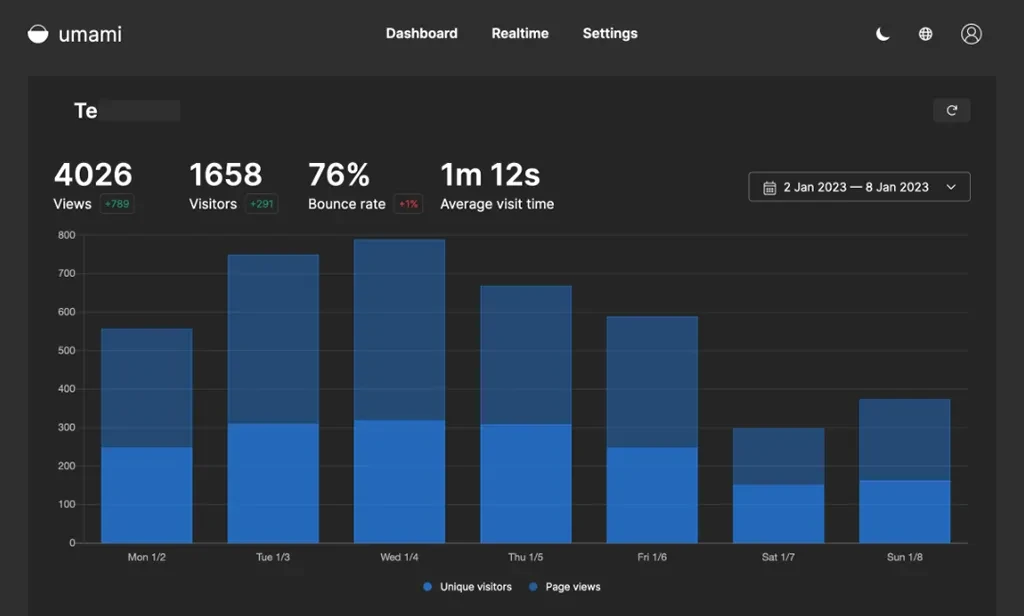
The data accuracy of Umami is a mixed bag. During the period of January 2 to 8, 2023, Umami recorded 1748 visitors, while Google Analytics counted 2707, which means that Umami undercounted visitors by 35.43%. This can be a shock to those who switch from Google Analytics without first doing a comparison.
| Visitor Date | Jan 2 | Jan 3 | Jan 4 | Jan 5 | Jan 6 | Jan 7 | Jan 8 | Jan 2-8 |
| Umami | 248 | 310 | 319 | 309 | 248 | 151 | 163 | 1748 |
| Google Analytics | 389 | 469 | 483 | 461 | 401 | 247 | 257 | 2707 |
| Deviation (%) | -36.25% | -33.90% | -33.95% | -32.97% | -38.15% | -38.87% | -36.58% | -35.43% |
However, when looking at the day-to-day visitor data collected by Umami, the data appears to be consistent and without any strange fluctuations. It is possible that Umami uses a different method of counting visitor data compared to Google Analytics.
In terms of page views data, the situation is different. During the same period, Umami recorded 4026 page views, while Google Analytics recorded 3430. This means that Umami overcounted page views by 17.38%. When looking at the day-to-day page views data, it can be difficult to understand.
| Page Views Date | Jan 2 | Jan 3 | Jan 4 | Jan 5 | Jan 6 | Jan 7 | Jan 8 | Jan 2-8 |
|---|---|---|---|---|---|---|---|---|
| Umami | 557 | 750 | 789 | 669 | 589 | 298 | 374 | 4026 |
| Google Analytics | 472 | 627 | 643 | 548 | 522 | 295 | 323 | 3430 |
| Deviation (%) | 18.01% | 19.62% | 22.71% | 22.08% | 12.84% | 1.02% | 15.79% | 17.38% |
While some days the data recorded by Umami is as accurate as Google Analytics with only a 1.02% difference, other days it is significantly more inaccurate. For example, on Jan 4 Umami recorded 22.71% more page views than Google Analytics.
In conclusion, Umami offers a simple, fast, and privacy-focused alternative to Google Analytics. While it has its advantages, such as real-time monitoring and a clean and easy-to-understand dashboard, the accuracy of its visitor and page views data can be questionable.
Umami tends to undercount visitor data and overcount page views, and the cloud version is currently not recording site data correctly. However, it is important to note that the data accuracy may improve in the future, as the developer continues to work on the product and its features.
Umami
Pricing: Free.
Hosting: Hosted, self-hosted.
Source code: Open sources.
Official site: https://umami.is/.
Conclusion
It's important to note that there is no single standard for correctly recording visitor data, as every analytics tool may have its own method. As long as the data is consistent on a day-to-day basis, I am comfortable using it. However, if there are inconsistencies, I would need to cross-check with the developer.
My experience with different Google Analytics alternatives has been mixed. Some of them, like Matomo and GoatCounter, have great products but the way they present data is difficult to understand.
For those with budget, I highly recommend Cabin, Fathom, Microanalytics, Plausible, or Simple Analytics. Out of these options, I personally prefer Plausible, due to its easily navigable dashboard, minimal impact on website loading with only 1 HTTP payload, and reasonable monthly pricing for the features offered.
For those without budget, Cabin offers a generous free option, while GoatCounter is a good choice if you're okay with its dashboard presentation.
If you are comfortable with managing, updating, and securing your own server, self-hosting options such as Plausible or Fathom Lite are also great choices.
If you're using WordPress, Jetpack Stats is definitely worth considering, not just for its analytics, but also for the various other features it offers.
In my case, I utilize Jetpack Stats for my this blog because it is well-integrated with WordPress and enables me to manage my blog from my mobile, a convenience not provided by any other alternative.
While this review only scratches the surface of the analytics tools available, I hope it provides a helpful overview of the key features and differences between each option.
If you're looking to dig deeper into a particular analytics tool, don't hesitate to reach out and let me know. I'd be more than happy to conduct further research and provide a more detailed analysis to help you find the right tool for your needs.
This page may contain affiliate/referral links, by purchasing via those links it means you are supporting me to keep creating. Read the affiliate disclosure to learn more.
This is a very interesting comparison, thanks.
I'm puzzled why you assume Google Analytics is accurate and base your "accuracy" figures on that. In my (limited) experience, Google Analytics was not very accurate, when I compare with server logs for example. Amongst the many issues were a large portion of my visitors just blocking Google Analytics altogether. Google are not very forthcoming about their collection and counting methods -- with the open source offerings, it's easy to see how the counts are triggered (and of course they have no vested interests in shaping the metrics, as they're not in the ads/page impressions business).
Thank you for sharing your experience with Google Analytics.
I use Google Analytics as a benchmark because it is popular and many people trust the data it provides, although it may not be completely accurate.
It's important to keep in mind that each analytics tool has its own way of collecting and counting data from websites.
Thanks for the comprehensive review. It was useful. I am considering add analytics to my blog, and this gives me a good idea of what to expect.
nice detailed article, thanks! i have tested some and finally landed on usermaven, which have a free tier and a paid tier. no cookie and seems gdpr compliant, but if you have more info about it i’ll be happy to read them.
Please consider testing piwik pro, which also has a generous free tier.
Great review - I'd really appreciate a review of statcounter if you get a chance.
We've been providing easy to understand web analytics for 25 years.
Thanks! I'll check out StatCounter for a review.
Hello, great overview. You can also check https://LiteAnalytics.com for your next review.
Lightweight, simple and easy to use, and we also provide free tier for up to 10K monthly page views, good starting point for smaller websites.